(A Text Based on Paul Palady’s Pro-active FMEA)
The proactive approach of the FMEA is based on the large area chart, which is strictly based on severity and occurrence (proactive scales of evaluation), these factors being the coordinates of the graph, being assigned alphanumeric codes for modes of failure and their effects. This chart has three distinct regions: a low priority region, a medium priority region, and a high priority region. The failure modes plotted in the high priority region are considered the most important. Thus, the importance of defined failure modes based on their location in the graph.
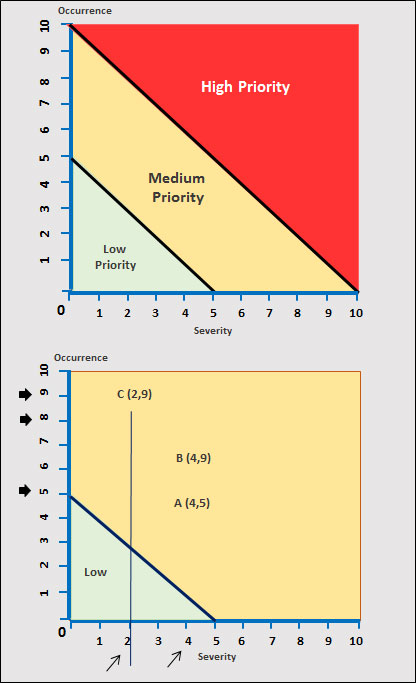
Also, in this scenario, the organization admits that all effects that result in a degree of severity equal to or greater than nine should be designated as a control characteristic, with point ten of the occurrence scale as the end point, obtaining the region of high priority. The team then defines that the average priority region is on a line from point four of the severity scale to five of the occurrence scale. Thus, it is emphasized that the first two failure modes to be investigated will be B and C.
In Figure 19 – Area Graph, the graduations obtained are shown based on severity and occurrence values.